MOOZY

A Patient-First Foundation Model for Computational Pathology

Yousef Kotp1,2, Vincent Quoc-Huy Trinh3,4, Christopher Pal2,5,6, Mahdi S. Hosseini1,2,7

1CSSE, Concordia University, Montréal, Canada   2Mila – Québec AI Institute, Montréal, Canada   3CHUM, Université de Montréal, Montréal, Canada   4IRIC, Université de Montréal, Montréal, Canada   5Université de Montréal, Montréal, Canada   6Canada CIFAR Chair, Polytechnique Montréal, Montréal, Canada   7Dept. of Pathology, McGill University, Montréal, Canada

🏆 Accepted at ECCV 2026

85.77M parameters
77,134 public slides
333 tasks from 56 datasets
23 anatomical sites

Quick Start

# install pip install moozy # encode from pre-computed H5 feature files moozy encode slide_1.h5 slide_2.h5 -o case_embedding.h5 # encode from raw whole-slide images (requires AtlasPatch, SAM2, and OpenSlide) moozy encode slide_1.svs slide_2.svs -o case_embedding.h5 --target_mag 20

Checkpoint and task definitions are downloaded automatically from HuggingFace on first use.

Abstract

Computational pathology needs whole-slide image (WSI) foundation models that transfer across diverse clinical tasks, yet current approaches remain largely slide-centric, often depend on private data and expensive paired-report supervision, and do not explicitly model relationships among multiple slides from the same patient. We present MOOZY, a patient-first pathology foundation model in which the patient case, not the individual slide, is the core unit of representation. MOOZY explicitly models dependencies across all slides from the same patient via a case transformer during pretraining, combining multi-stage self-supervision with scaled low-cost task supervision. In Stage 1, we pretrain a vision-only slide encoder on 77,134 public slide feature grids using masked self-distillation. In Stage 2, we align these representations with clinical semantics using a case transformer and multi-task supervision over 333 tasks from 56 public datasets, including 205 classification and 128 survival tasks across four endpoints. Across sixteen held-out tasks, MOOZY improves macro weighted F1, balanced accuracy, and macro weighted ROC-AUC relative to PRISM by +4.19%, +7.93%, and +6.95%, respectively. MOOZY is also parameter efficient with 85.77M parameters, 14× smaller than GigaPath. These results suggest that patient-level pretraining yields transferable embeddings, providing a path toward scalable patient-first histopathology foundation models.

Two-Stage Training Pipeline

MOOZY two-stage training pipeline

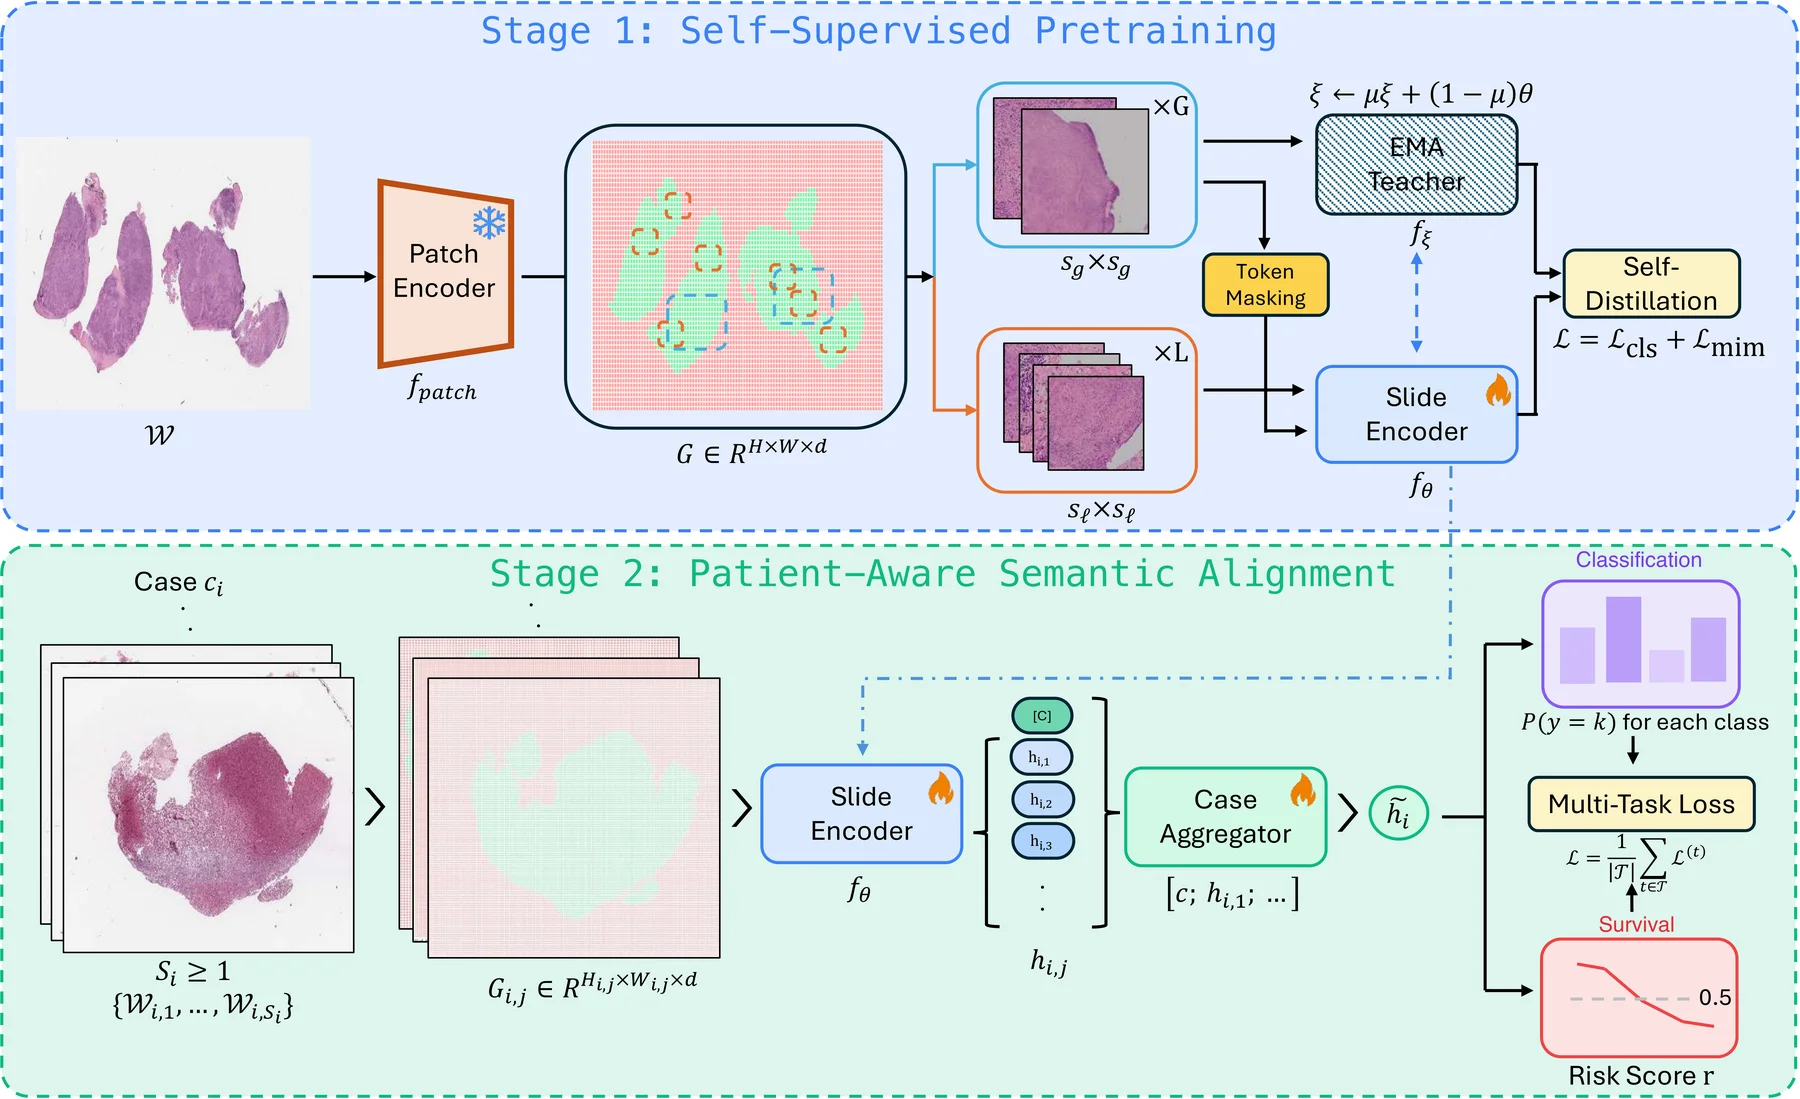
Stage 1 (top): A frozen patch encoder extracts per-patch features arranged into a spatial grid. Multi-scale crops are sampled with spatial augmentations and block-based masking. A student slide encoder and EMA teacher are jointly trained via CLS-level self-distillation and masked patch prediction. Stage 2 (bottom): The pretrained slide encoder produces per-slide embeddings; a case transformer aggregates them into a unified case embedding, routed to task-specific classification and survival heads.

Training Data Scale

MOOZY data scale overview

MOOZY is trained entirely on public data. Stage 1 uses 77,134 slide feature grids (53,286 at 20× and 23,848 at 40×) extracted from ~1.67 billion patches across ~31.8 TB of raw WSI data. Stage 2 uses 41,089 supervised cases (45,179 unique whole-slide images) across 333 tasks from 56 datasets — all 32 TCGA cohorts, all 10 CPTAC cohorts, REG, BC-Therapy, BRACS, CAMELYON17, DHMC Kidney, DHMC LUAD, EBRAINS, IMP Colorectum, IMP Cervix, MBC, MUT-HET-RCC, NADT Prostate, NAT-BRCA, and PANDA. Supervision covers 205 classification and 128 survival tasks across four endpoints (OS, DSS, DFI, PFI) and 23 anatomical sites.

Results

MLP-probe weighted F1 radar comparison across slide encoders

(a) MLP-probe weighted F1 across sixteen held-out tasks. Brackets show [min–max] per task (center = min, outer ring = max).

Linear-probe weighted F1 radar comparison across slide encoders

(b) Linear-probe weighted F1 across the same sixteen held-out tasks.

Macro-averaged weighted F1 versus total parameter count

(c) Macro-averaged weighted F1 (MLP probe) vs. total parameter count (log scale). Bubble size indicates total parameters.

Frozen-feature MLP probe on sixteen held-out tasks. Bold = best, underline = second best. Mean ± std over 5 folds.

Task Metric CHIEF GigaPath PRISM Madeleine TITAN MOOZY
Residual Cancer BurdenF10.460.450.460.510.430.56
AUC0.600.550.580.630.580.74
Bal. Acc0.440.400.430.480.380.51
TP53 MutationF10.820.760.850.840.870.87
AUC0.810.760.850.850.910.86
Bal. Acc0.830.760.840.840.880.86
BAP1 MutationF10.860.840.800.850.840.89
AUC0.750.630.710.780.820.79
Bal. Acc0.750.660.660.750.750.78
ACVR2A MutationF10.890.800.850.890.870.91
AUC0.800.740.830.760.790.91
Bal. Acc0.800.650.810.810.760.90
Histologic GradeF10.710.770.730.750.730.78
AUC0.710.770.670.740.710.75
Bal. Acc0.730.770.730.740.730.77
KRAS MutationF10.770.770.720.810.800.85
AUC0.760.720.610.700.800.80
Bal. Acc0.740.760.630.770.810.79
IDH StatusF10.920.940.910.920.940.97
AUC0.960.970.950.960.970.99
Bal. Acc0.920.940.910.910.940.97
Treatment ResponseF10.530.510.570.490.490.58
AUC0.700.680.690.590.600.68
Bal. Acc0.480.400.510.350.370.48
BRCA PAM50 SubtypeF10.670.680.700.680.720.63
AUC0.830.830.850.840.870.80
Bal. Acc0.510.520.570.530.580.50
HNSC mRNA SubtypeF10.540.600.600.590.620.55
AUC0.750.770.780.770.790.72
Bal. Acc0.550.610.590.580.610.54
UCEC Genomic SubtypeF10.550.570.630.570.660.56
AUC0.750.760.810.750.820.74
Bal. Acc0.530.540.600.550.620.52
Synaptophysin GradeF10.780.790.760.810.800.79
AUC0.610.740.500.680.640.61
Bal. Acc0.640.690.580.650.680.65
RAS/BRAF StatusF10.890.890.840.880.900.94
AUC0.680.480.560.330.800.75
Bal. Acc0.680.680.570.660.680.85
Keratinizing SCC GradeF10.740.680.720.690.720.73
AUC0.750.690.740.720.720.72
Bal. Acc0.730.680.720.690.710.72
Non-Keratinizing SCC GradeF10.800.780.750.800.810.77
AUC0.660.610.520.660.710.66
Bal. Acc0.790.750.720.790.780.73
Primary vs. MetastasisF10.920.920.920.930.930.93
AUC0.620.600.660.750.770.69
Bal. Acc0.570.580.630.630.640.65

Macro-average across sixteen held-out tasks. Each entry averages over five MIL architectures (MeanMIL, ABMIL, CLAM, DSMIL, TransMIL).

MetricBackboneUNI v2Phikon v2CONCH v1.5MUSKMOOZY
F1 (weighted)0.7230.7220.7140.7400.7200.769
ROC-AUC (weighted)0.7070.7070.6970.7200.6950.763
Balanced Acc0.6430.6370.6250.6610.6370.702

Macro-average across sixteen held-out tasks. Each stage and the case aggregator are toggled independently.

SettingStage 1Stage 2Case Agg.F1AUCBal. Acc
Stage 1 only0.7430.7150.662
Stage 2 only w/o case agg.0.7430.7210.664
Stage 2 only0.7310.6970.659
MOOZY w/o case agg.0.7490.7370.682
MOOZY0.7690.7630.702

Where Does MOOZY Look?

A board-certified pathologist reviewed attention maps across 20 representative WSIs sampled from eight held-out evaluation cohorts and five encoders. MOOZY achieved the lowest mean semantic gap score (1.00, versus 1.38 for TITAN and 1.75 for PRISM) and near-balanced tumor vs. non-tumor attention (shift 2.63), suggesting broad, diagnostically relevant coverage.

Embedding Quality

Dimensionality reduction of slide embeddings from four encoders. MOOZY shows the clearest class separation on cancer-type tasks.

MOOZY embedding

MOOZY

TITAN embedding

TITAN

Madeleine embedding

Madeleine

PRISM embedding

PRISM

Citation

@inproceedings{kotp2026moozypatientfirstfoundationmodel, title={MOOZY: A Patient-First Foundation Model for Computational Pathology}, author={Kotp, Yousef and Trinh, Vincent Quoc-Huy and Pal, Christopher and Hosseini, Mahdi S.}, booktitle={European Conference on Computer Vision (ECCV)}, year={2026}, url={https://arxiv.org/abs/2603.27048}, }